The dashboard turns your weekly calculations into trends. Use it to see the project story across completed weeks rather than judging performance from one number.
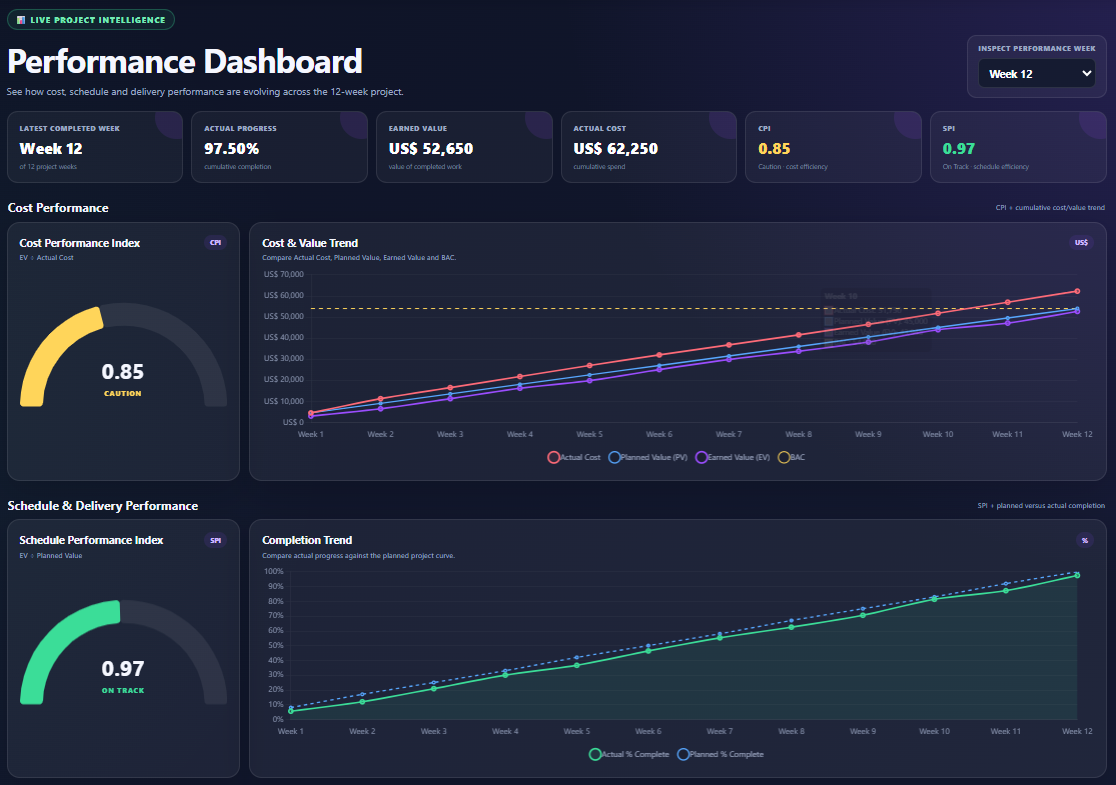
Performance gauges
Cost efficiency
Progress against plan
Trend charts
The cost chart should be read by comparing actual cost and earned value against the planned value/budget reference. The time/performance view compares actual project progress with the planned progression across the 12 weeks. Future actual results are not treated as completed performance.
A single CPI or SPI tells you the current relationship. The trend helps you see whether performance is improving, deteriorating or fluctuating from week to week.
Still not finding the answer to your question?
Our support team can help. Tell us what you were trying to do and, if possible, include a screenshot of what you see.