The weekly report is where the work completed and project cost are converted into EVM information. It is the learning core of the simulation.
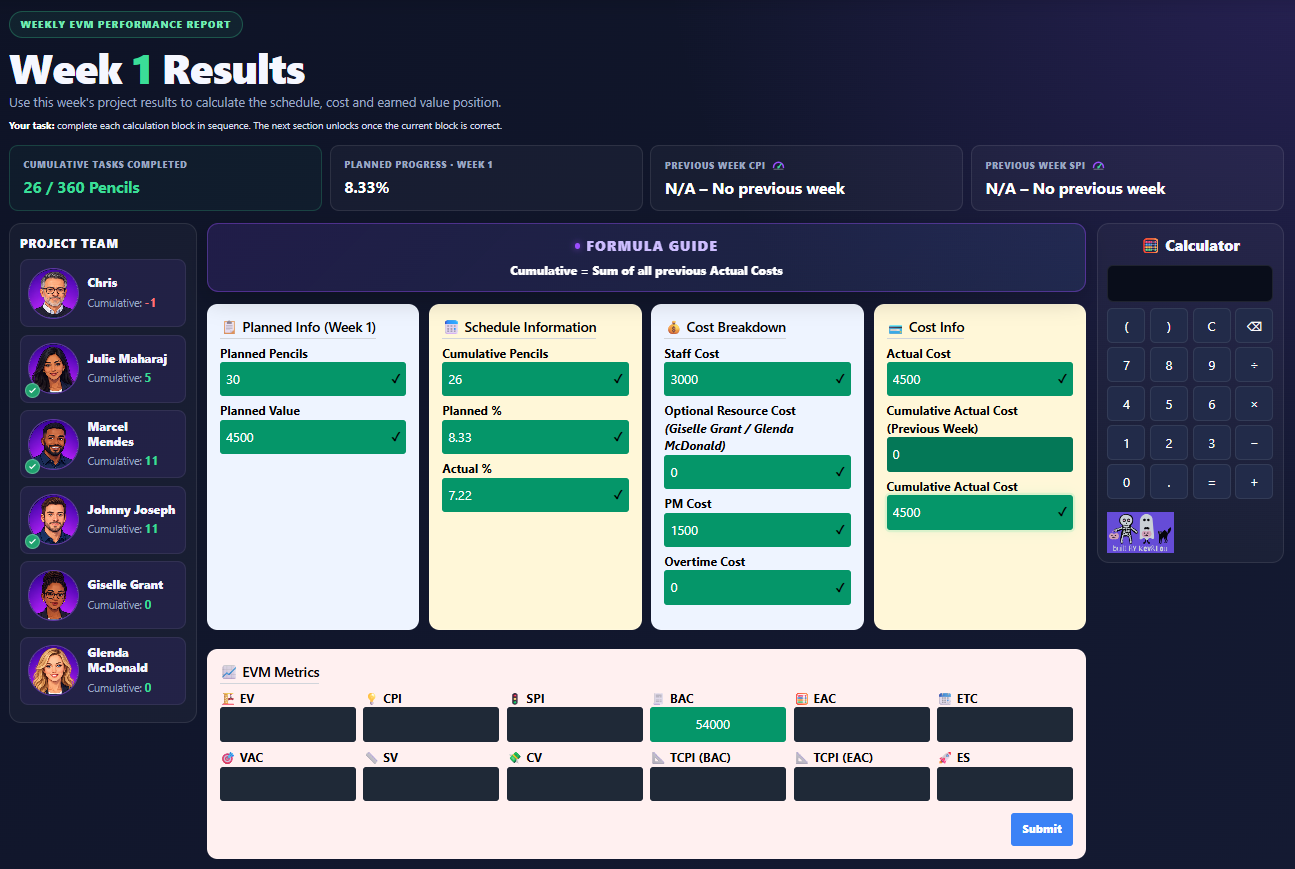
Work through the report in layers
1ProgressWeekly and cumulative tasks, planned progress and actual progress.
→
2CostStaff, additional resources, PM and overtime costs.
→
3EVMPV, EV, CPI, SPI, variances and forecasts.
Core calculations
| Measure | Formula / basis | What it tells you |
|---|---|---|
| EV | Actual progress × BAC | Budgeted value of completed work |
| CPI | EV ÷ AC | Cost efficiency |
| SPI | EV ÷ PV | Schedule progress efficiency |
| EACD | 12 ÷ SPI | Estimate at Completion Duration in weeks |
| EAC | BAC ÷ CPI | Forecast final project cost |
| ETC | EAC − AC | Forecast remaining cost |
| VAC | BAC − EAC | Forecast budget variance at completion |
| CV | EV − AC | Current cost variance |
| SV | EV − PV | Current schedule variance expressed in value |
✨ Formula interaction
On the redesigned report, click a calculation card to draw attention to the formula. The card highlights briefly while the formula is displayed at the top, helping connect the answer to the calculation used.
Don't chase the answer
The purpose of the report is to understand why the result changed. Look back at work completed, resources used, overtime and cumulative cost before deciding what the next week needs.
Still not finding the answer to your question?
Our support team can help. Tell us what you were trying to do and, if possible, include a screenshot of what you see.